Solving ocean crises by unifying and empowering global communities!sm
With the help of donors like you, OpenOceans Global is developing solutions to save our ocean.
With the help of donors like you, OpenOceans Global is developing solutions to save our ocean.
Title search: ✖
|
Show All (46)
General (7) OpenOceans News (2) OPP Initiative (1) Plastic Treaty (9) Press Releases (2) Solutions (6) Trash and Plastics (23) White Papers (1)
New Report Provides Global Criteria to Address Problematic, Unnecessary, and Avoidable Plastic Products
Corporate Plastic Pollution Scorecard provides an in-depth review of the plastic packaging practices
|
U.S. plastic recycling is astonishingly inconsistent, showing opportunity for improvement
Whether the public distrusts the potential for recycling plastic or the adoption of plastic recycling infrastructure has been too slow, the reality is that the implementation of plastic recycling in the U.S. varies widely by both types of plastic and geography. While recycling isn’t the whole answer to addressing the ocean plastic crisis, having sufficient recycled plastic feedstock is critical to meeting sustainability goals being adopted by governments around the world and to reducing the amount of virgin plastic being produced. A 2021 Eunomia study commissioned by the Ball Corporation, “The 50 States of Recycling,” took a comprehensive look at recycling in the United States, not only for plastic but for all recycling, including cardboard, paper, aluminum, and glass. The Ball Corporation supplies sustainable aluminum packaging solutions for beverage, personal care, and household products and is well-known for its glass Mason jars. The study had these key takeaways:
State recycling rates vary widely
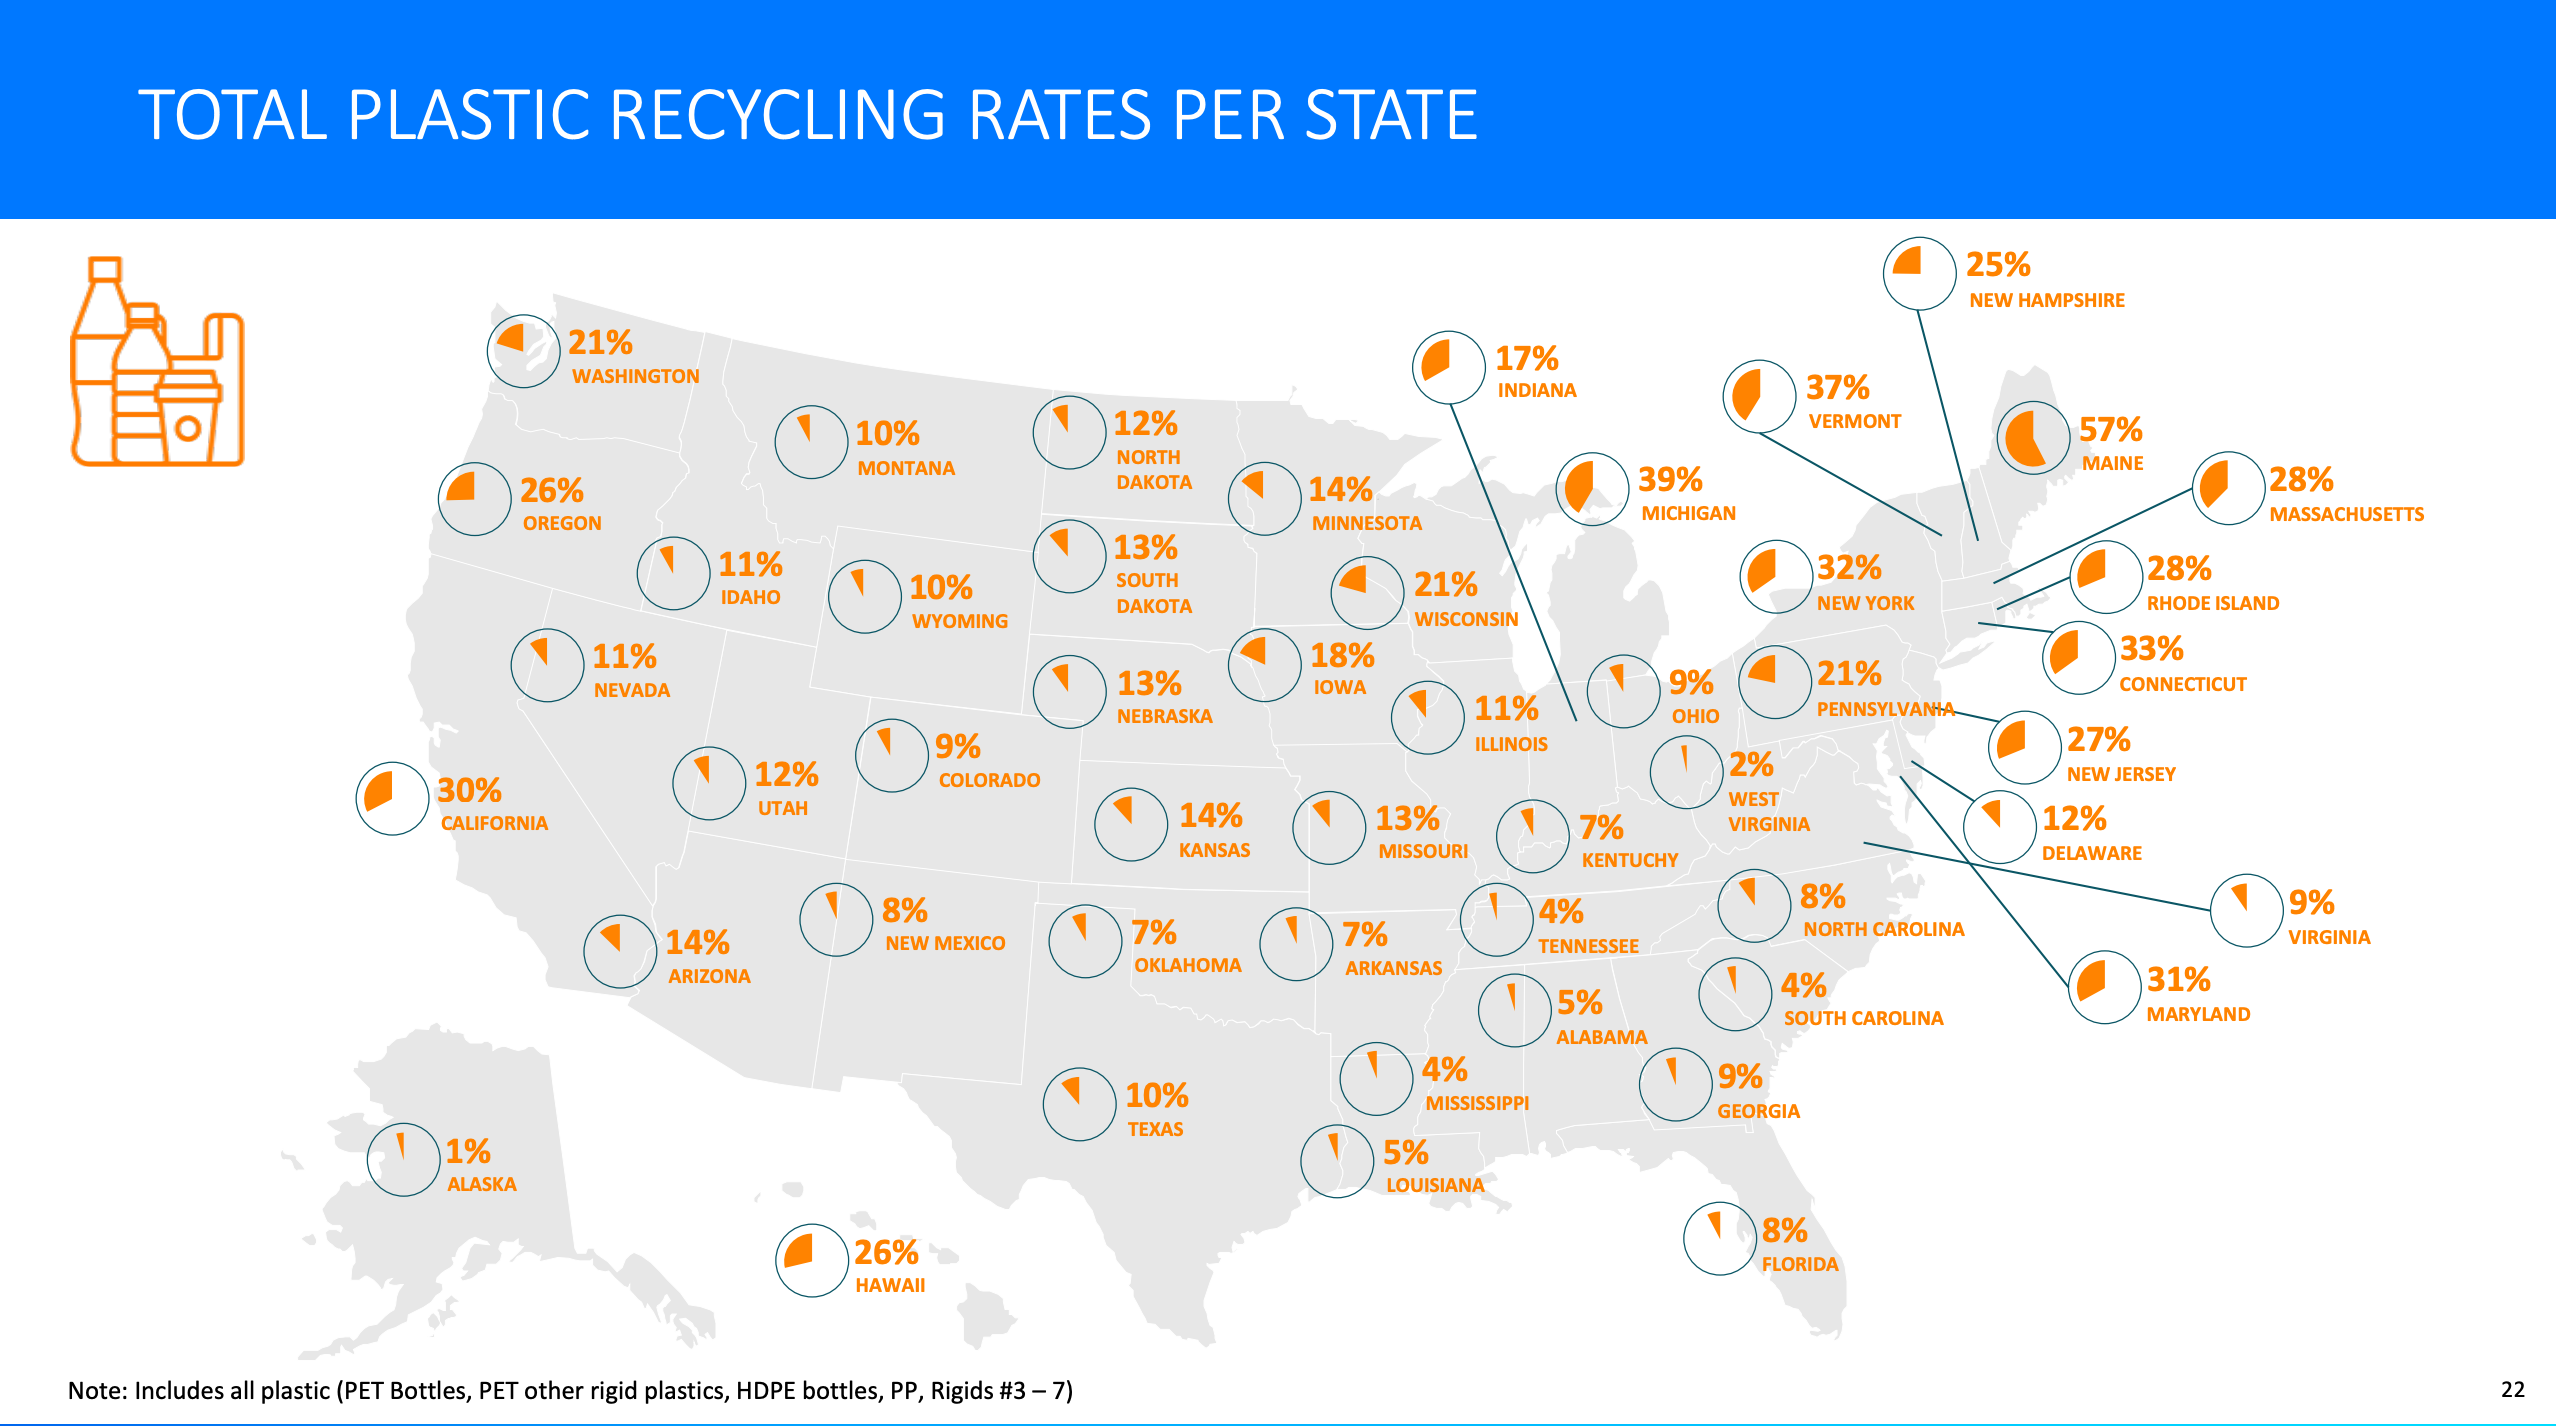
Image Credit: Eunomia/Ball Corporation The Eunomia report provided several charts like the one above that shows the incredible variability between the states in the amount of plastic that is recycled. Why does Maine recycle 57% of its plastic and West Virginia only 2%?The inconsistency of recycling plastic from state to state as documented in the report is astounding. The outright leader is Maine, which recycles 57% of its plastic. Michigan is second at 39%. Contrast those percentages with states like West Virginia, which recycles 2%, and Mississippi, Tennessee, and South Carolina, which recycle only 4% of their plastic. The takeaway is that great improvement is possible and that Maine has set a standard that is not just aspirational but achievable. Could all states recycle 72% of PET bottles like Maine?The numbers for polyethylene terephthalate (PET) bottles are even more astounding. According to the Ball study, Maine recycles 72% of its PET bottles, while South Carolina recycles only 2% of its PET bottles. Globally, even higher standards have also been achieved. Norway has a 97% recycling rate for PET bottles, according to Plastics Today. India achieves a 90% recycling rate due to the value of PET bottles to the nation’s trash pickers, according to multiple sources. How much of each resin type is recycled?
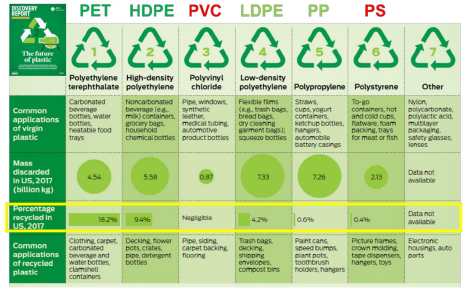
Image credit: State University of New York Plastic product recyclability can be described by seven categories. According to a State University of New York study in 2017, these three categories of plastic had the highest recycling rates in the U.S.
The recycling rate is less than 1% for each of the other four types of plastic.
Comparing the amount of plastic discarded by type with the percentage recycled shows the opportunity to expand recycling, particularly given the number of U.S. states that have very limited rates of recycling, as shown in the Eunomia report. Some additional factoids from the report:
Americans support action to improve recyclingThe report also conducted a consumer survey of 4,000 adults in March 2021 to identify national attitudes about recycling. The amount of support for recycling was overwhelming.
The purpose of Ball Corporation's state-by-state assessment of recycling was to allow comparable recycling rates to be calculated. This calculation sets a baseline in each state that can be used to inform policy, design programs, and assess infrastructure needs. While recycling is only one part of solving the ocean plastic crisis, OpenOceans Global’s position is that this data clearly documents that great gains can be made in plastic recycling if the political will and funding are available. The data provides not just aspirational goals, but achievable goals that could be adopted in each state and globally. The most impact can be had in plastic resin types 1, 2 and 4. The full Eunomia report commissioned by the Ball Company can be found here. A “key insights” presentation can be found here. |