Solving ocean crises by unifying and empowering global communities!sm
With the help of donors like you, OpenOceans Global is developing solutions to save our ocean.
With the help of donors like you, OpenOceans Global is developing solutions to save our ocean.
Title search: ✖
|
Show All (46)
General (7) OpenOceans News (2) OPP Initiative (1) Plastic Treaty (9) Press Releases (2) Solutions (6) Trash and Plastics (23) White Papers (1)
New Report Provides Global Criteria to Address Problematic, Unnecessary, and Avoidable Plastic Products
Corporate Plastic Pollution Scorecard provides an in-depth review of the plastic packaging practices
|
May 18, 2023 The Ocean Plastic Crisis – Mapping Source to SeaSource Identification as a SolutionAn OpenOceans Global White Paper
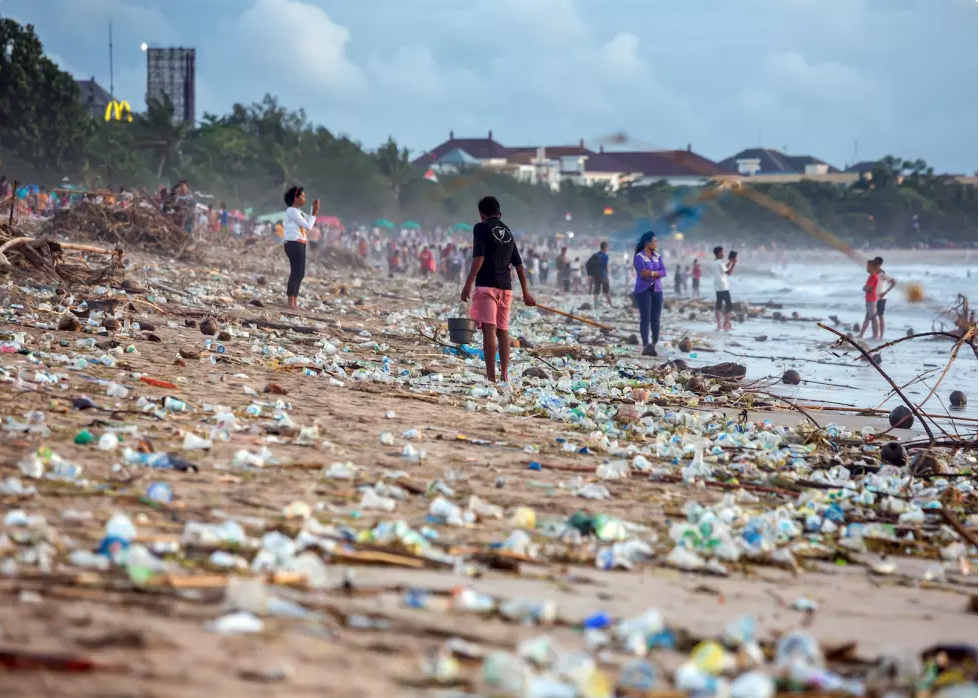
Kuta Beach, Bali Indonesia, Image Credit: Shutterstock // Maxim Blinkov Plastic is ubiquitous in environments throughout the world. The ocean is no exception. While public perception imagines marine plastic concentrated in the deep ocean in garbage patches trapped in the ocean gyres, 75% of ocean plastic is actually on beaches and shorelines. With this knowledge,
Plastic Pathways to the OceanPlastic can only reach the ocean and its shorelines through four pathways:
OpenOceans Global seeks to:
A Global Problem with Local ImpactPublic knowledge of the geographical source of the plastic is critical to understanding and implementing the best solutions. Visualization and documentation are important tools for local leaders to understand the scope of the problem. Often, the ocean plastic crisis is seen as a global problem that can only be solved globally. While this is true to an extent, solutions require stemming the flow of plastic from-and- to local sources before it reaches the ocean. All plastic debris is ultimately local, so local solutions must be implemented to solve the crisis. OpenOceans Global is curating a set of solutions by category that can be assessed for application at each location where accumulations of plastic on shorelines are found. Mapping the Flow from Source to SeaOne category of solutions involves forensics. Once the location of an accumulation of plastic debris is documented, the pathway it traveled must be determined. OpenOceans Global is mapping and documenting beaches that regularly accumulate plastic. Once documented, the pathway taking plastic to that beach must be determined. From the Galapagos to the Bahamas, researchers have been working to develop forensic strategies to identify the pathways by which plastic accumulates on local shorelines. This is the first step in finding solutions. OpenOceans Global is curating solutions and making them available for use where ocean plastic pollution is a problem. Approaches to Shutting Off the FlowInternationally, there have been two major approaches to addressing the ocean plastic crisis and shutting off the flow.
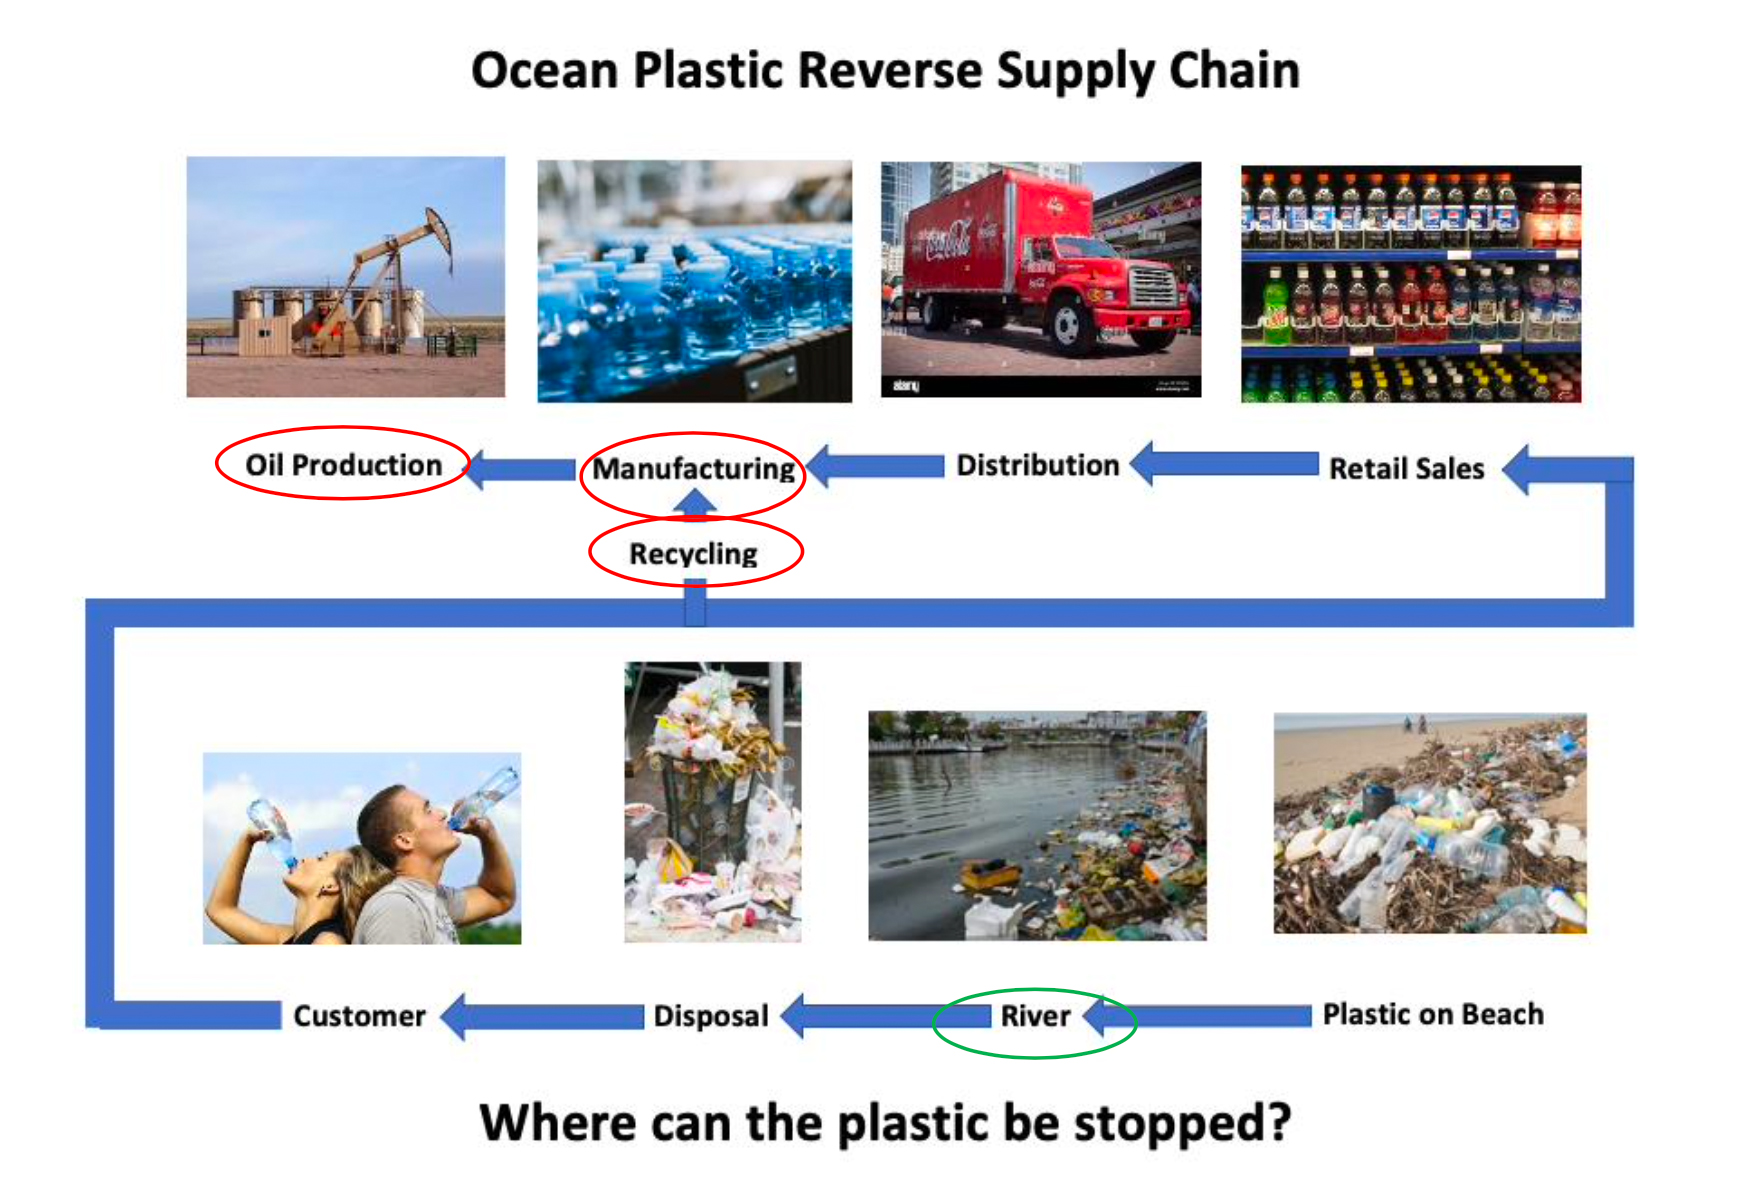
These important long-term approaches effectively seek to implement the difficult task of changing and restructuring the entire supply chain currently supported by plastic production.
The red circles indicate where the primary focus internationally has been placed on stopping the flow of plastic. While this critical work needs to continue at an urgent pace, OpenOceans Global believes another emphasis should be placed on the green circle, representing the places closest to where most plastic reaches the sea – rivers, local litter, and fishing gear. _____________________________________________________________________________________________________________________________________ This third strategy is important because, even as the United Nations works to complete an actionable and binding international plastic treaty by 2024, it is likely that:
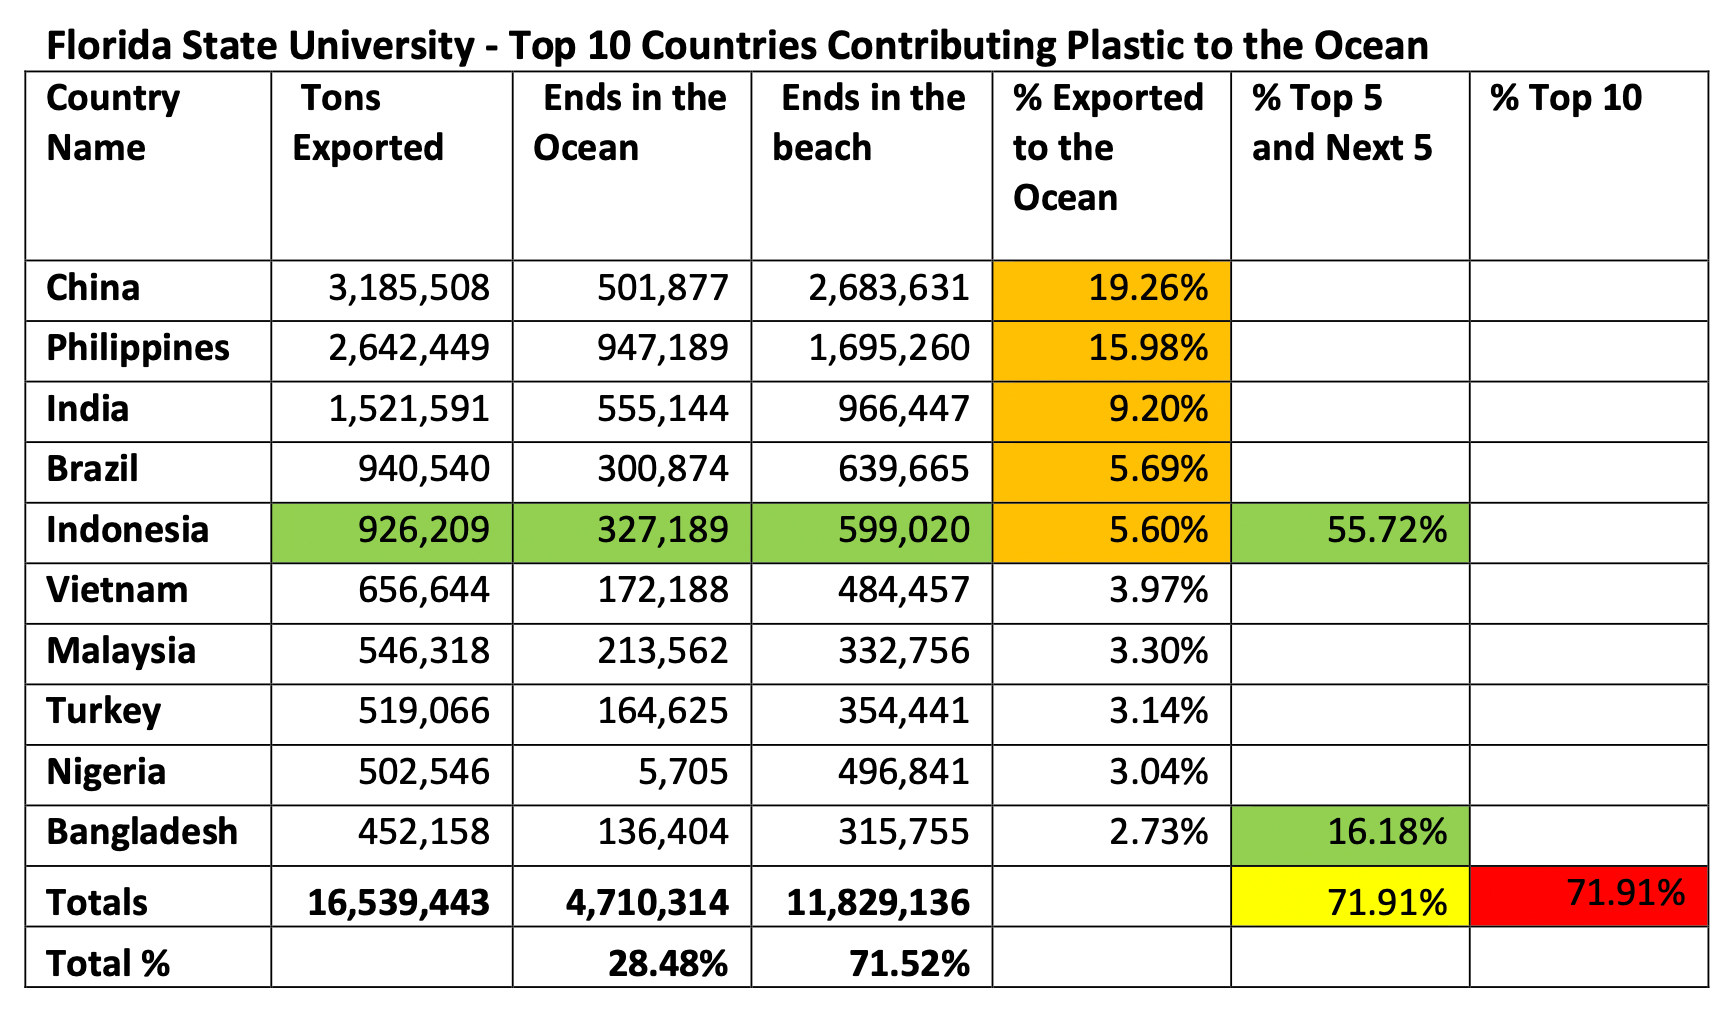
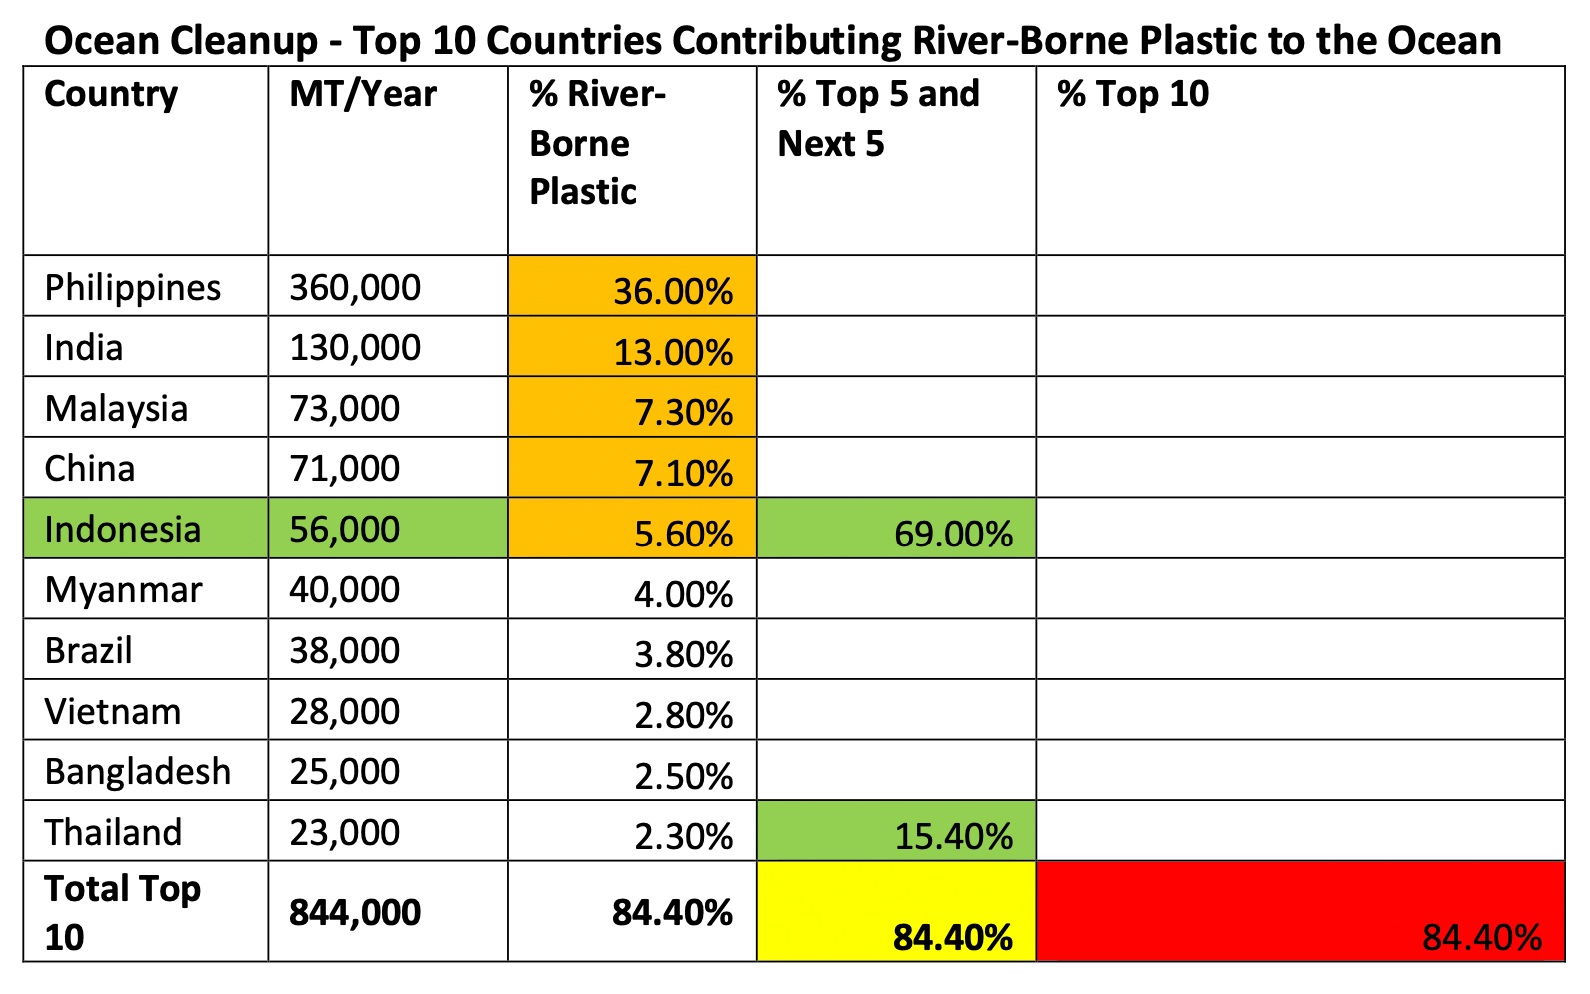
11 Million Metric Tons Soon to Become 29 MTUntil the first two approaches are fully implemented, plastic will continue to flow into the ocean. The Pew Charitable Trust estimates that 11 million metric tons of plastic go into the ocean every year and will increase to 29 million tons by 2040 under current practices. Pew also developed a list of strategies to be implemented that, if fully funded and universally applied, will reduce 78% of the plastic flowing into the ocean. That means five million metric tons of plastic will still flow into the ocean each year, even if Pew’s strategies are fully funded and universally implemented. This is truly a crisis that makes the OpenOceans Global strategy critical. 70% of Ocean Plastic Comes from Five CountriesKnowing the countries where the majority of plastic reaches the ocean is important to implementing this third solution. While the U.S. and other developed nations are leaders in the production and use of plastic, they aren’t the primary sources of marine plastic to the sea. The U.S. directly contributes less than 1% of plastic to the world’s oceans. One percent of 11 million tons is more than 100,000 metric tons, still a significant amount, and the U.S. must continue to reduce the plastic it does contribute to the ocean. However, five countries in Asia contribute as much as 70% of plastic to the world’s oceans, and ten countries contribute up to 84%, according to the best data available.
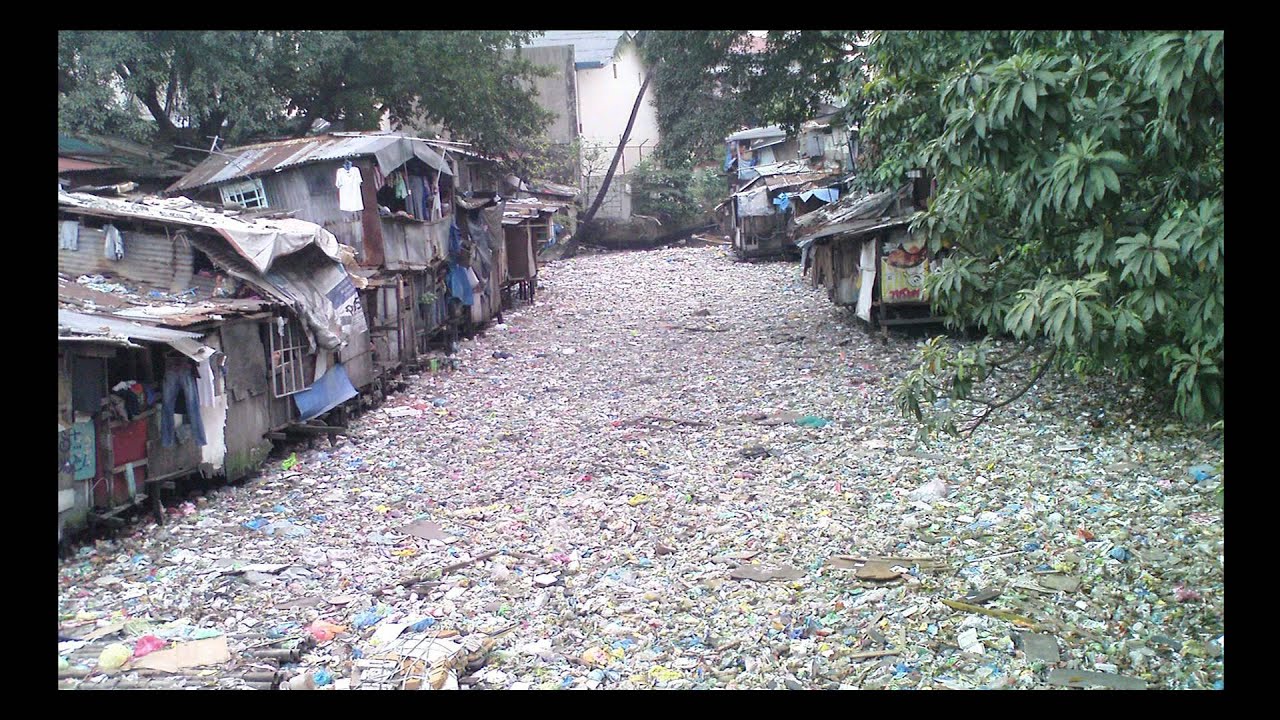
The Pasig River is the most plastic-polluting river in the world. Image Credit: Gulf News and Asian Development Bank To reduce the growing amount of plastic in the ocean, there must be an international focus on the places where the most plastic reaches the sea, even as changes in supply chains and in-country work continue in the richer, developed nations. One reputable study estimates that 36% of all river-borne ocean plastic comes from the Philippines. Another says the Philippines contributes 15%. No matter the actual number, placing a collaborative international priority on the Philippines, China, India, Malaysia, Indonesia, and Brazil (which all contribute more than 5%) would go a long way to reduce the amount of plastic reaching the ocean while testing and implementing the best solutions to achieve that end. Three primary studies inform our understanding of the ocean plastic crisis.
Key data and OpenOceans Global’s analysis of that data can be found below. It is important to recognize that variations in the absolute amount of plastic contributed can be attributed to different assumptions. For instance, the Ocean Cleanup data only looks at river-borne plastic from the 1,000 rivers that contribute the most. The total from those rivers is one million metric tons. Other estimates are based on country totals using models that make assumptions about the amount of mismanaged waste in each country and how much of it reaches the ocean. No matter the absolute numbers, the scale of the numbers is consistent in pointing to the countries that provide the most plastic pollution to the ocean.
ConclusionThe ocean plastic crisis has implications not only for marine life and the environment but also for human health, climate change, and how we approach the future. Since 75% of ocean plastic is on beaches and other shorelines, stopping the flow of plastic from reaching beaches will also stop most of the flow from reaching coastal waters and the deep ocean. Plastic that doesn’t reach the ocean won’t become marine microplastic, and the chemicals of concern found in plastic won’t become part of the marine ecosystem. As a final note, there would not be an ocean plastic crisis if there was universal waste management like that found in much of the developed world. There would still be too much plastic, and the initiatives underway to address that plastic would still be needed, but the ocean would have far less plastic. Mapping Plastic-Fouled Beaches
Curating the Best Solutions● To view the current list of solutions or add a solution to be considered for addition to the OpenOceans Global website go to: https://www.openoceans.org/solutions Carl Nettleton, President/Founder Click here to see this publication as a PDF. © 2023 OpenOceans Global
|