Solving ocean crises by unifying and empowering global communities!sm
With the help of donors like you, OpenOceans Global is developing solutions to save our ocean.
With the help of donors like you, OpenOceans Global is developing solutions to save our ocean.
Title search: ✖
|
Show All (49)
General (8) OpenOceans News (2) OPP Initiative (1) Plastic Treaty (9) Press Releases (2) Solutions (8) Trash and Plastics (24) White Papers (1)
New Report Provides Global Criteria to Address Problematic, Unnecessary, and Avoidable Plastic Products
Corporate Plastic Pollution Scorecard provides an in-depth review of the plastic packaging practices
|
The Same Four Plastic Pollutants Show Up Around the WorldThe U.S. and global cleanup data tell a similar story—with different proportions
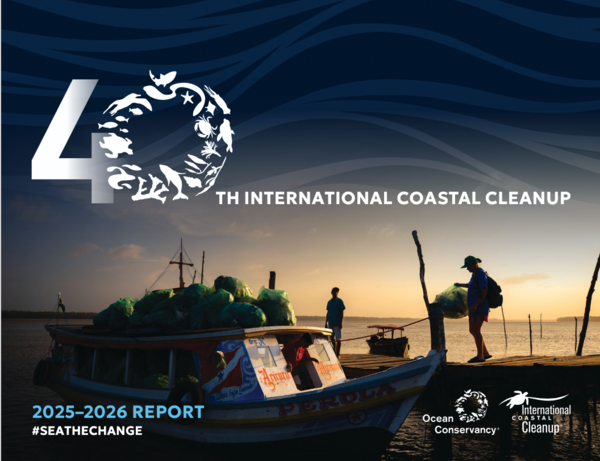
Image credit: Ocean Conservancy At first glance, the United States and global results in the Ocean Conservancy’s 2026 International Coastal Cleanup (ICC) Report appear different. Look more closely, however, and a more important pattern emerges: The same top four identifiable plastic items appear prominently in both datasets: cigarette butts, plastic beverage bottles, plastic bottle caps, and food wrappers.
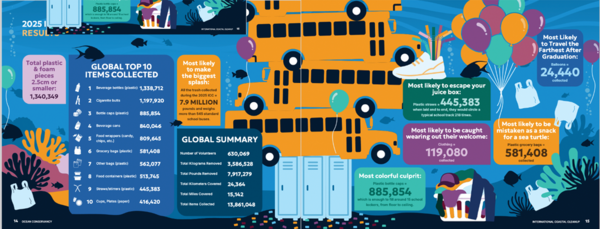
What differs is not so much what is showing up, but how frequently each item is found. The 2026 report presents results from cleanups conducted in 2025. Globally, more than 630,000 volunteers collected 13.9 million items weighing nearly 7.9 million pounds. The ICC has now recorded nearly 440 million pieces of debris since the program began in 1986. See all cleanup reports here.
Four items, two rankings Globally, plastic beverage bottles were the most commonly collected item, followed by cigarette butts and plastic bottle caps. Food wrappers ranked fourth overall for identifiable items. Volunteers recorded more than 1.3 million plastic beverage bottles, 1,197,920 cigarette butts, 886,000 bottle caps, and 810,000 food wrappers. The U.S. ranking was different. Cigarette butts ranked first (312,208 collected, 26% of the global total), bottle caps second (150,517), food wrappers third (149,131), and plastic beverage bottles fourth (115,601). The difference is striking, but the underlying pattern is not. The same four recognizable consumer products are among the most frequently collected plastic items in both datasets. The U.S. simply has a different mix: cigarette butts are much more prominent, while beverage bottles are relatively more prominent globally. That distinction matters because it shows the same products are repeatedly escaping into the environment, but their relative importance varies from place to place. What Ocean Conservancy sees in the data
Image credit: Ocean Conservancy The Ocean Conservancy uses the ICC not simply to document litter, but to identify opportunities for prevention.
ICC data found that plastic-bag policies were associated with a 25–47% reduction in plastic bags found in the environment. A critical limitation: these are counts, not weights The ICC data tell us how many items volunteers found. They do not tell us how much plastic each category represents by weight, although total weight is captured. The ICC therefore provides a powerful measure of what is frequently entering the environment, but not a ranking of which products contribute the greatest mass of plastic. The bigger message After 40 years of cleanups, the United States and the rest of the world are finding the same four identifiable plastic items again and again. The proportions differ. The rankings differ. But the basic pattern is remarkably consistent. That matters because it suggests plastic pollution can be partially tackled by focusing attention on a relatively small number of products—and by tailoring interventions to the products most prevalent in each market. The ICC tells us what volunteers are finding. The opportunity now is to use those data to determine why these products are escaping into the environment and what changes will keep them from getting there in the first place. |