Solving ocean crises by unifying and empowering global communities!sm
With the help of donors like you, OpenOceans Global is developing solutions to save our ocean.
With the help of donors like you, OpenOceans Global is developing solutions to save our ocean.
Title search: ✖
|
Show All (50)
General (8) OpenOceans News (2) OPP Initiative (1) Plastic Treaty (10) Press Releases (2) Solutions (8) Trash and Plastics (24) White Papers (1)
Follow the money to understand the connection between the UN Plastic Treaty challenges and top plastic-producing countries
New Report Provides Global Criteria to Address Problematic, Unnecessary, and Avoidable Plastic Products
Corporate Plastic Pollution Scorecard provides an in-depth review of the plastic packaging practices
|
Follow the money to understand the connection between the UN Plastic Treaty challenges and top plastic-producing countries
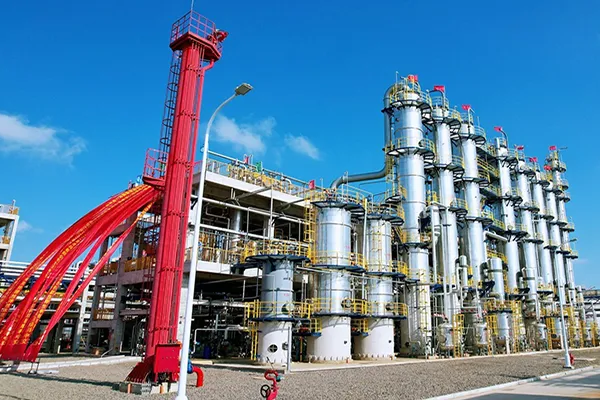
A new styrene-butadiene copolymer (SBC) project in Hainan, China, has an annual capacity of 170,000 tons. Sinopec now boasts the world's largest production capacity SBC plants. Image credit: SINOPEC According to a report by Zero Carbon Analytics, 96 countries known as the High Ambition Coalition back reductions in plastics production, a key sticking point in the UN Plastic Treaty negotiations. A small number of plastic-producing countries known as the Like-Minded Group, often led by Iran, have opposed the measure. What economic and political imperatives block global agreement on reducing plastic pollution? Following the money is a good place to start. The High Ambition Coalition and the environmental community see reducing plastic production as essential to the agreement. As the numbers below show, reducing plastic production would affect the economies of the top plastic-producing countries and the profits of corporations that produce plastic feedstock and plastic products. Zero Carbon Analytics says:
The top plastic producing countries and companies Global plastic polymer production exceeds 450 million tonnes annually. Seven countries account for 66% of plastic polymer production:
18 companies are responsible for 51% of global plastic production:
Notably, none of the 96 countries in the High Ambition Coalition for a Strong Plastic Treaty appear on the list of top plastic-producing countries, making it easier for them to support firm regulations. In addition, countries that subsidize plastic production frustrate market-based change by keeping their companies’ plastic output artificially competitive. What does a country-level look reveal about U.S. plastics production?
The Plastics Industry Association's 2026 Size & Impact Report illustrates the challenge of reducing plastic production at the country level. While the report was published to promote the value of the plastics industry, it provides insights into the challenge of reducing plastic production and the likely resultant reductions in economic outputs of the plastics industry in the U.S. Here are some conclusions:
How does China affect the outlook on plastic production?
ECHEMI.com provides a country-level view of China in its December 2025-2026 Outlook for the General Plastics Industry. Here are some relevant growth statistics:
China also has some headwinds facing its ambitious growth goals:
The takeaway: China wants to maintain and expand its position as one of the world’s major plastic production bases. For example, according to a June 30, 2026, report by McKinsey & Company, China plans to increase its 2025 polyethylene production from 42 million tons by an additional 23 million tons by 2030. As reported by ECHMI.com, polypropylene, polystyrene, and ABS are expected to expand by more than 10% in 2026, with polyethylene growth reaching as high as 27.31%. Unlike China, the U.S. has no national goal for plastic growth, but the U.S. plastic industry will still want to expand production capacity, fueled by private investment. According to the United States Plastic Market Report by Type, Application, End User, States and Company Analysis 2025-2033, the plastic industry is projected to achieve a compound annual growth (CAGR) of 3.94% from 2025 to 2033, growing from $195.27 billion in 2025 to $266.25 billion in 2033. Can the two top producers realign? How can the two largest plastic-producing countries be convinced to reverse those goals and support reducing plastic production? Answering this question is essential to building a consensus-based treaty. The U.S. position on reducing plastic production aligns with the economic data. An August 24, 2026, Washington Post story reported that “The United States has doubled down on its opposition to plastic production limits in global treaty talks … pushing to create a broad loophole to disregard the treaty on national security grounds.” China may be taking an approach that differs from its production goals. According to a September 26, 2025, story in Politico, “the Asian superpower and the world's biggest plastic producer subtly changed its language on tackling the plastic crisis, admitting the problem has to do with the entire life cycle of plastic and thus raising hopes of a breakthrough at a next round of talks.” Politico reports that the European Union’s strategy has been to “break China away from Saudi Arabia and the U.S.” The belief is that other major players, including Russia and India, will become more comfortable with a comprehensive plastic treaty if China becomes more cooperative while trying to fill the leadership vacuum created when the U.S. backed away. The next formal UN Plastic Treaty negotiating session, known as INC-5.4, is officially scheduled to take place within the window of March 13 to March 24, 2027. The location has not been finalized. |